
 Whilst we might be best known for our accounting reports on the likes of Noble Group and AirAsia, we also conduct detailed analysis of the listed corporate sector with a focus on capex, free cash flows and leverage. This enables us to tell whether the corporate sector is in a position to support an investment up-cycle or whether a prolonged down-cycle is likely. We gather data from over 32,000 listed non-financials across 43 markets over a 20 year horizon.
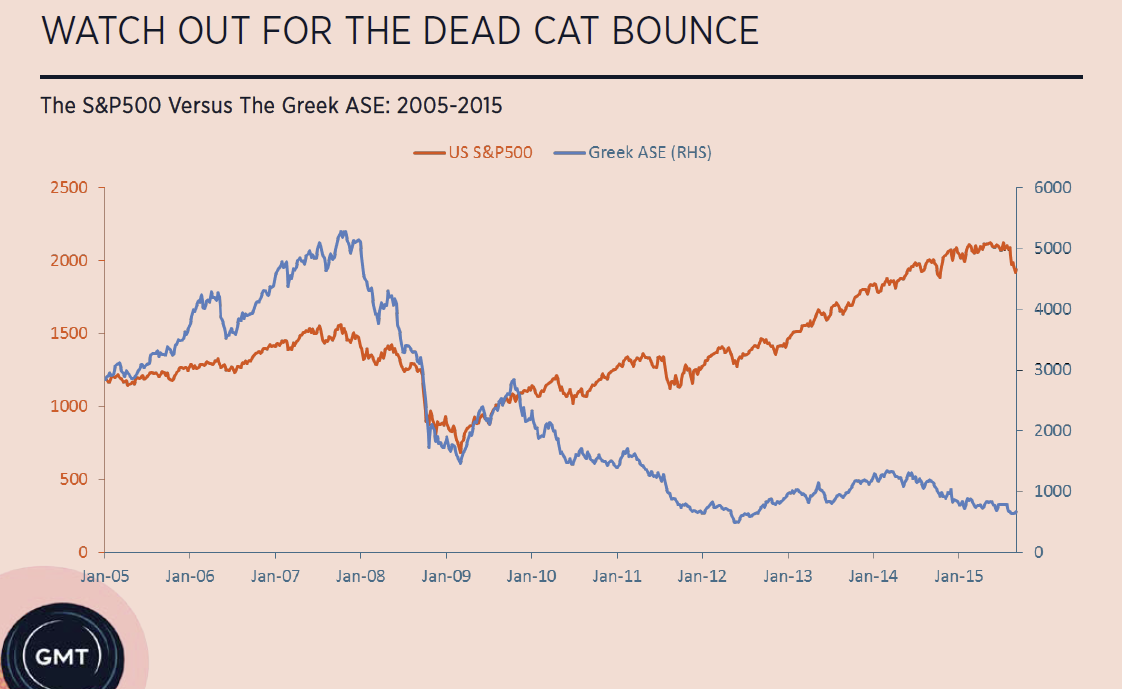
This analysis has historically been very accurate. It threw up red flags for Thailand in 1995, two years before the onslaught of the Asian Financial Crisis in July 1997. By comparison, the World Bank issued a report on foreign debt in March 1997, just three months before the Asian Financial Crisis, claiming that Thailand and Malaysia were low risk. They got that one wrong! Meanwhile, Greece was throwing up all sorts of red flags in 2006. Not only does our system tell you where to be careful, it also tells us where it's relatively safe to invest. For example, our analysis showed that Southeast Asia's corporate sector had recovered by 2002/3. The stock market then went on to have a massive bull market rally. Meanwhile, Italy and Spain look like they're well on the way to recovery today although poor Greece is still a mess.
Gillem Tulloch talks through our methodology
The logic behind this analysis is fairly simple. If a market’s corporate sector displays an already high level of capex relative to depreciation, an investment up-cycle is under-way. If this leads to free cash outflows, corporate leverage is likely rising and the market is probably mid-to-late cycle. A combination of aggressive capex, free cash outflows and high leverage, suggests that the market is probably close to the end of the up-cycle. as such, there is likely to be a credit event such as rising non-performing loans, capital flight, etc. In the absence of government stimulus, the corporate sector is then likely to enter a down-phase as companies cut capex in order to generate free cash inflows from which to repay debt.
It is important to remember that capex is the main driver of the business cycle. As capex rises, corporate profits expand, GDP accelerates and stock markets rise. If for some reason companies cut capex, profits will contract, GDP will slow and the stock market will normally fall. Clearly, markets with the greatest potential for a strong investment upcycle start off with low levels of capex, generate free cash inflows and have reasonable leverage. Likewise, those with the greatest downside risk already have high capex, free cash outflows and high leverage.
We see how this works in Thailand in the run up to the 1997 Asian Financial Crisis in the charts below. Between 1992 and 1996, capex was 2-3x depreciation suggesting fixed asset growth in excess of 20% per annum. This led to free cash outflows that equated to between 40-90% of Operating Cash Flows (OPCF or sometimes called Cash From Operations). Aggressive outflows let to rising leverage which rose from 2.6x debt/OPCF* in 1992, to around 8x by 1996. By comparison, the global average over the last 20 years has been 3x. Over this period, Thai GDP growth exceeded 8% per annum and the stock market more than doubled.
 In 1996, the bubble began to deflate as companies ran out of capacity to take on more debt and returns began to fall due to over-capacity. Capital flight led to the devaluation of the Thai baht and given that companies had significant exposure to un-hedged foreign debt, forex losses wiped out shareholders’ equity. In order to restore solvency, companies slashed capex by over 70% with the aim of generating free cash inflows to repay debt. Naturally, corporate profits collapsed, the economy shrank by up to 10% and the stock market crashed.
 Our system works best in emerging markets. That’s because the banking sector has yet to penetrate the consumer sector. As such, it’s the consumer which drives the cycle in more developed markets but the corporate sector in emerging markets. Also, we can’t just add all the financial statements together to get our results. In this event, the output would simply reflect the largest companies, such as PetroChina in China or PTT in Thailand. These government ceded concessions don’t look like the rest of the economy. We’re not trying to replicate an index but to understand what’s going on in an economy in the belief that this will feed back into the stock market. As such, we use a consistent sample based on sales across each market and then a mixture of means and medians.
After collecting data on 32,000 companies we’ve mapped the corporate sector of 42 markets around the world where we have a large enough quorum of companies that meet our criteria. On our first metric of capex relative to depreciation it probably comes as no surprise that China’s capex has been the second highest globally over the past five years. With capex at 2.5x depreciation, it suggests that gross fixed assets have been growing at about 25% per annum. However, it is likely a surprise that India has the highest capex at 2.7x depreciation over the past five years. We’ve been led to believe by the financial press that India is about to embark on a capex up-cycle, only to find that it’s already in the midst of one.
 It’s a similar story for free cash flows. Most of the corporate world generates free cash inflows, even high-growth emerging markets. China is one of the few markets where the corporate sector is experiencing free cash outflows at around 19% of OPCF. However, once again it is India that leads the pack with outflows equating to 58% of OPCF. This is entirely consistent with an economy which is aggressively investing.
 For once, India does not lead the pack when it comes to the highest leverage; no, that dubious honour goes to Croatia (on 10.9x debt/OPCF) and then Greece (10.2x), Europe’s basket-cases. Unfortunately, India follows not far behind on 8.9x debt/OPCF with China on 7.1x. Leverage is higher than Europe’s other basket cases which include Spain on 7.0x and Italy on 5.0x.
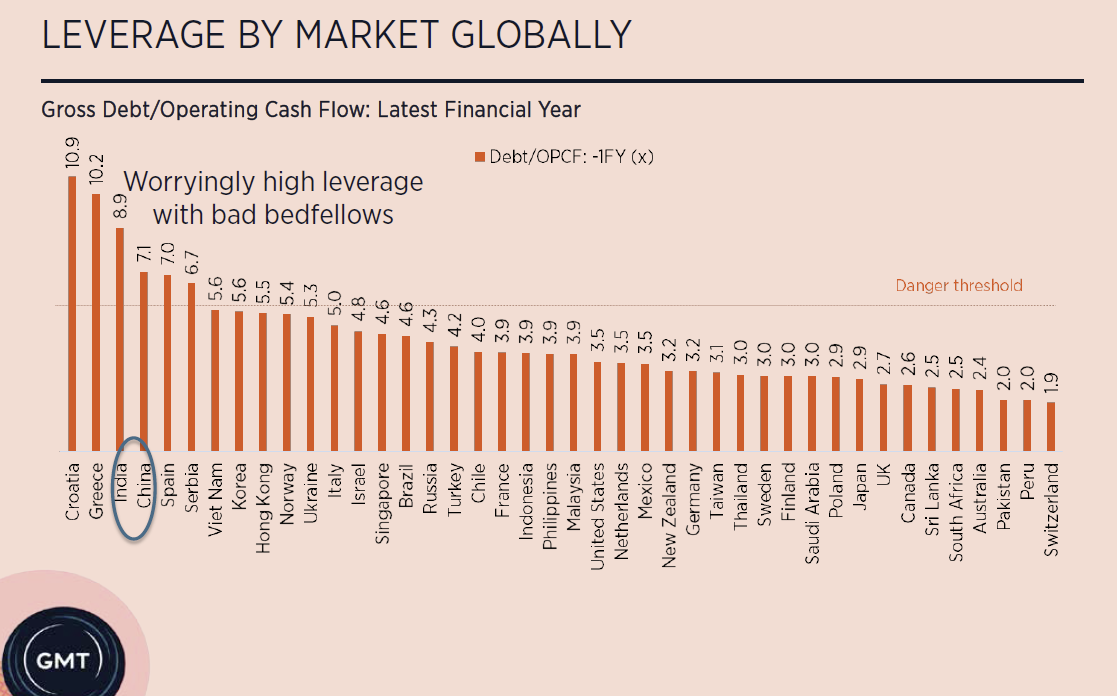 The good news is that with the exception of a few problem markets, corporate leverage across the globe looks reasonable. Even some of yesterday’s problem markets are beginning to recover. For example, Italy and Spain are generating copious quantities of free cash inflows which is beginning to down-pay debt. China’s continued economic slowdown would seem to make sense in light of an over-leveraged corporate sector which is hemorrhaging free cash outflows. However, it is India where we are most at odds with consensus. How can the corporate sector accommodate an investment up-cycle when it is already aggressively investing, recording free cash outflows and is over-indebted?
Worse still, those markets with the highest corporate leverage globally also have the highest stock market valuations globally, namely India and China, as shown in the chart below. After all, isn't this what you would expect if they were in the midst of credit driven bubble? For the purposes of this analysis, we have applied a 5% trimmed mean to a practical investment universe. As such, we have conducted the analysis on companies with a market capitalisation exceeding US$1bn, domiciled and listed by market. We have shied away from using Bloomberg derived index valuations as they tend to be slanted towards one or two large companies. We should point out that China is on 36x PER assuming it achieves forecast EPS growth of more than 50% YoY. There's no chance of this growth target being met, just as last year's 50% growth forecast came in at single digits. China will be lucky to achieve positive EPS growth this year. In short, the market is actually far more expensive than shown shown here. Likewise for India as well.
To conclude, analysing the listed corporate sector can shed light on where a market lies within the business cycle. We prefer to rely on the financial statements of listed companies because it gives us far greater insight than GDP statistics. We can drill down into companies by sector and size to see precisely where distortions are occurring. By comparison, GDP numbers are far less transparent and often prone to political interference.
It is clearly a concern that the two major markets with the highest corporate leverage are also the most expensive stock markets in the world, namely India and China. However, let's be clear that we are not calling for a repeat of the Asian Financial Crisis. There is much that policy makers can do and have done to delay a day of reckoning. Unfortunately, it is unlikely that corporate earnings growth will pick up from moribund levels and, as such, the world's most expensive stock markets look vulnerable. When that de-leveraging cycle is finally allowed to begin, these stock markets might well correct and then just crawl sideways for a few years as growth slows further. The good news is that this would be a great buying opportunity.
This article summarised two reports written for GMT Research's subscribers. For more details on how to become a subscriber, please email info@gmtresearch.com for more information.
* Some readers might not be familiar with our leverage ratio, debt/OPCF. The OPCF number is taken from the cash flow statement. It is calculated by taking net profit and then adding back non-cash items and adjusting for changes in working capital. OPCF is normally about 1.2x reported net profit. Both capex and debt repayment are financed from OPCF. Our ration then tells us how long it would take a company to repay its debt if capex was brought to zero. The global average has been around 3x over the past 20 years which is what we would expect given that the average loan duration is three to five years.
