Beneish’s M-Score is a mathematical model that uses eight financial ratios weighted by coefficients to identify whether a company has manipulated its profits. It was created by Professor Messod Beneish who published a paper in June 1999 called The Detection of Earnings Manipulation. Beneish surmises that companies are incentivised to manipulate profits if they have high sales growth, deteriorating gross margins, rising operating expenses and rising leverage. They are likely to manipulate profits by accelerating sales recognition, increasing cost deferrals, raising accruals and reducing depreciation. These eight ratios are explained in greater detail as follows:
- Days’ Sales in Receivables Index (DSRI): A large increase in receivable days might suggest accelerated revenue recognition to inflate profits.
- Gross Margin Index (GMI): A deteriorating gross margin sends a negative signal about a firm’s prospects and creates an incentive to inflate profits.
- Asset Quality Index (AQI): An increase in long term assets (for example, the capitalisation of costs), other than property plant and equipment, relative to total assets indicates that a firm has potentially increased its involvement in cost deferral to inflate profits.
- Sales Growth Index (SGI): High sales growth does not imply manipulation but high growth companies are more likely to commit financial fraud because their financial position and capital needs put pressure on managers to achieve earnings targets. If growth firms face large stock prices losses at the first indication of a slowdown, they may have greater incentives to manipulate earnings.
- Depreciation (DEPI): A falling level of depreciation relative to net fixed assets raises the possibility that a firm has revised upwards the estimated useful life of assets, or adopted a new method that is income increasing.
- Sales, General and Administrative Expenses (SGAI): Analysts might interpret a disproportionate increase in SG&A relative to sales as a negative signal about a firm’s future prospects, thereby creating an inventive to inflate profits.
- Leverage Index (LVGI): Leverage is measured as total debt relative to total assets. An increase in leverage creates an incentive to manipulate profits in order to meet debt covenants.
- Total Accruals to Total Assets (TATA): Total accruals are calculated as the change in working capital (other than cash) less depreciation relative to total assets. Accruals, or a portion thereof, reflect the extent to which managers make discretionary accounting choices to alter earnings. A higher level of accruals is, therefore, associated with a higher likelihood of profit manipulation.
The eight variables are then weighted together according to the following formula:
Beneish M-Score = -4.84 + 0.92*DSRI + 0.528*GMI + 0.404*AQI + 0.892*SGI + 0.115*DEPI – 0.172*SGAI + 4.679*TATA – 0.327*LVGI
Beneish concluded that if a company scored greater than -2.22 (i.e. a less negative or positive number) there was a likely probability of profit manipulation. We have recreated the formula and attempted to calculate the results for 3,600 Asian companies with a market capitalisation exceeding US$1bn. Unfortunately, Beneish designed his formula with US disclosure in mind and many Asian companies do not distinguish between COGS and SG&A. As such, we can’t calculate the formula for 19% of our sample, including the majority of those in Australiana and India. That’s a shame because the latter market would have been particularly interesting. Our calculations suggest that 96% of all companies score within a range of +/-5. We have displayed the scoring system in the following chart to make it easier to understand:

The results show that in the five years between 2010 and 2015, 33% of companies recorded a Beneish M-Score greater than -2.22, although this dropped to just 16% if we raise the threshold to -1.78. In other words, according to Beneish, earnings manipulation has likely been widespread across Asia. In 2015, 30% of all companies scored greater than -2.22, falling to just 15% for those scoring greater than -1.78.
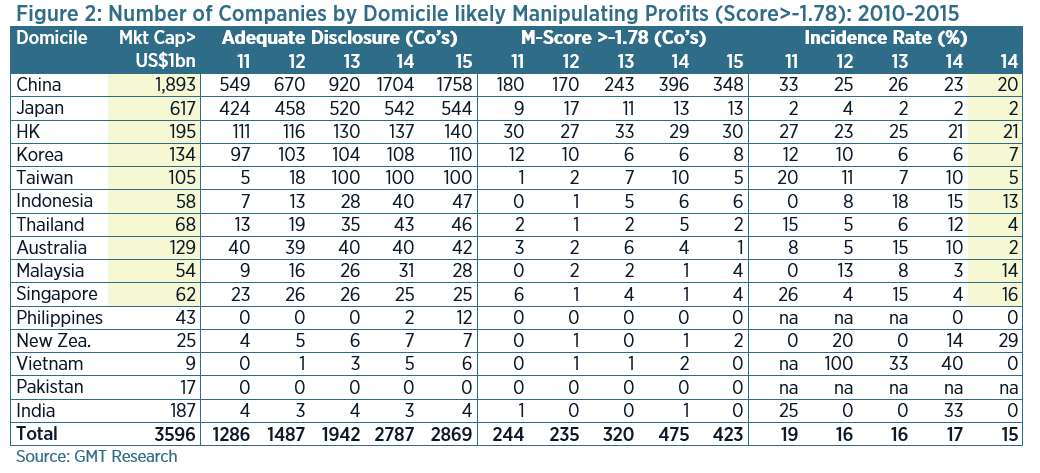
In the following table, we highlight the incidence rate by domicile for those companies with a Beneish M-Score greater than -1.78. It’s perhaps no surprise that 89% of all companies likely manipulating their profits are domiciled in Hong Kong and China. Part of this is down to the sheer number of companies listed there, but the incidence rate is also the highest at 20-21%, compared to 5% elsewhere.
Beneish argued that he could correctly identify 76% of manipulators, whilst only incorrectly identifying 17.5% of non-manipulators. In a further paper in 2007, The Predictable Cost of Earnings Manipulation, he used the M-Score as a stock selection technique from 1993 to 2003. This strategy generated a hedged return of nearly 14% per annum. A subsequent paper called, Identifying Overvalued Equity, showed that an overvaluation score (O-Score) combining proxies for earnings overstatement, merger activity, stock issuance, and the manipulation of operating activities was able to identify firms with forecast abnormal price declines averaging -27%.