We penalise companies with a high and/or rising deferred tax asset relative to industry peers. A deferred tax asset may be used to reduce taxable income. They are most commonly created from the carry-over of losses. For example, if a company makes a loss in a financial year, it is usually entitled to use that loss in order to lower its future taxable income. As such, a deferred tax asset is created upon the loss and then offset against future taxable income.
Deferred tax assets also arise when where there is a difference between accounting rules and tax rules. For example, deferred taxes exist when expenses are recognized in the income statement (such as provisions) before they are required to be recognized by the tax authorities (upon losses), or when revenue is subject to taxes before it is taxable in the income statement. Another example is when a company impairs or writes-off its assets for accounting purposes which are not recognised for tax purposes. As explained in our report, GOODWILL HUNTING: Using acquisition accounting to inflate earnings (1 Nov 2016), some companies will impair newly acquired assets in order to inflate accounting profits. This results in significant deferred tax assets.
Our scan picks up deferred tax assets which are recognised on the balance sheet; however, notes to accounts reveal deferred tax assets which have been de-recognised. This is especially interesting to investors as these assets are de-recognised by management and auditors when there is a reasonable chance that the company will be unable to generate future profits to utilise them. This can be an indicator that a company is struggling. For example, in our report, NOBLE GROUP: Turning Tax Losses into Accounting Profits (1 Apr 2015), the growth in deferred tax assets and the large quantity of re-recognised deferred tax assets suggested that not all was well within the company. Unfortunately, financial data providers do not collate this data and, as such, we are unable to monitor it.
In general, deferred tax assets are a relatively small balance sheet item, typically equating to less than 2% of sales, as Figure 28 shows. By comparison, inventories, receivables and cash average 10-15% of sales. We would expect capital intensive companies, such as utilities and communications, to have high levels of deferred tax assets as they attempt to minimise taxable profits reported to the authorities whilst maximizing profits reported to shareholders.

Deferred tax assets account for less than 2.5% of sales in most markets but are noticeably higher in two places, Spain and Italy, where they are in excess of 4%. This is likely caused by losses generated in the aftermath of the Global Financial Crisis. Corporate leverage was extremely high and the crisis resulted in significant losses. 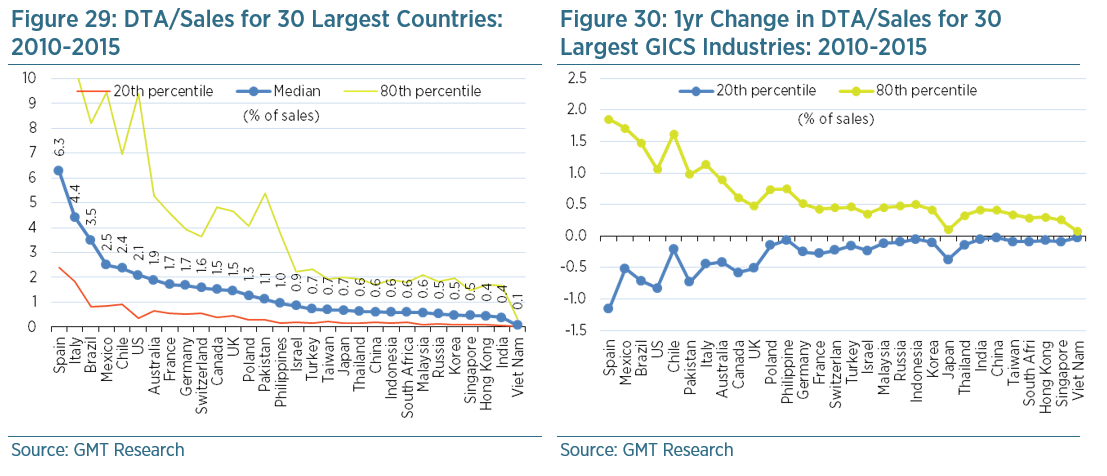
Our accounting screen is set to trigger a red flag when DTA/sales exceeds the 80th percentile (i.e. they are very high) relative to GICS industry peers, and/or when there is an abnormally large increase relative to the normal rate of change amongst industry peers over one and three years. This latter red flag is triggered when the increase in DTA to sales exceeds the 80th percentile relative to the change experienced by industry peers between 2010 and 2015.