Includes investments carried at cost or market and owned purely for investment purposes. It also includes long-term loan investments, long-term trade receivables and long-term interest-bearing receivables, available for sale and held to maturity securities classified as long term, interest-bearing amounts due from related companies (greater than 1 year) and investments in unconsolidated subsidiaries or associated/related investments valued at cost.
We penalise companies with a high and/or rising level of long term investments & receivables (LTI&R) relative to industry peers. In calculating this formula, we look at the outstanding balances of LTI&R over the past three years relative to the last reported sales number. In other words, we are interested in the outstanding balances and changes in LTI&R relative to the most recent sales number. This is to avoid red flags being triggered by falling sales. Also, changes LTI&R are less likely to be a function of sales than of investment decisions.
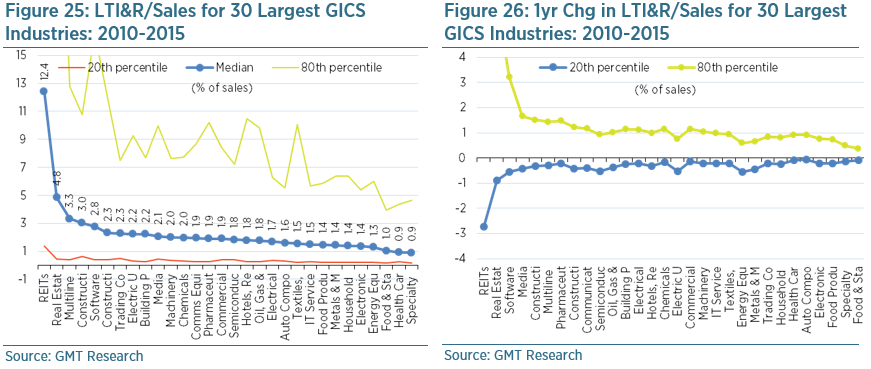
Investors should monitor LTI&R as this is where companies can attempt to hide dead assets such as overdue receivables or unconsolidated subsidiaries. We have compared LTI&R to industry peers given that each industry has a very different sales composition. Still, as the following chart shows, LTI&R typically only account for 1-3% of sales. The only exceptions are industrial conglomerates and real estate developers. Interestingly, these industries also have a very wide dispersion between the 20th and 80th percentiles. The likely reason is that sometimes investment properties are included in this section.
Our accounting screen is set to trigger a red flag when LTI&R/sales exceeds the 80th percentile (i.e. they are very high) relative to GICS industry peers, and/or when there is an abnormally large increase relative to the normal rate of change amongst industry peers over one and three years. This latter red flag is triggered when the increase in LTI&R to sales exceeds the 80th percentile relative to the change experienced by industry peers between 2010 and 2015.