A simple Red Flag Score is arguably more insightful than an Average Percentile Score as it tells us how many ratios in a company’s financial statements are highly unusual. We first count the number of red flags triggered in the latest financial period. Secondly, we percentile score the number of red flags against our global sample. In Figure 2, we have taken our sample of 16,000 companies and calculated the percentage of companies which trigger a specific number of red flags for 2015. For example, 8% of companies recorded 8 red flags. Around 58% of all companies scored between 7 and 14 red flags. A company that scores 22 red flags is in the 95th percentile relative to all 16,000 companies, as shown in Figure 3. This would be cause for concern.

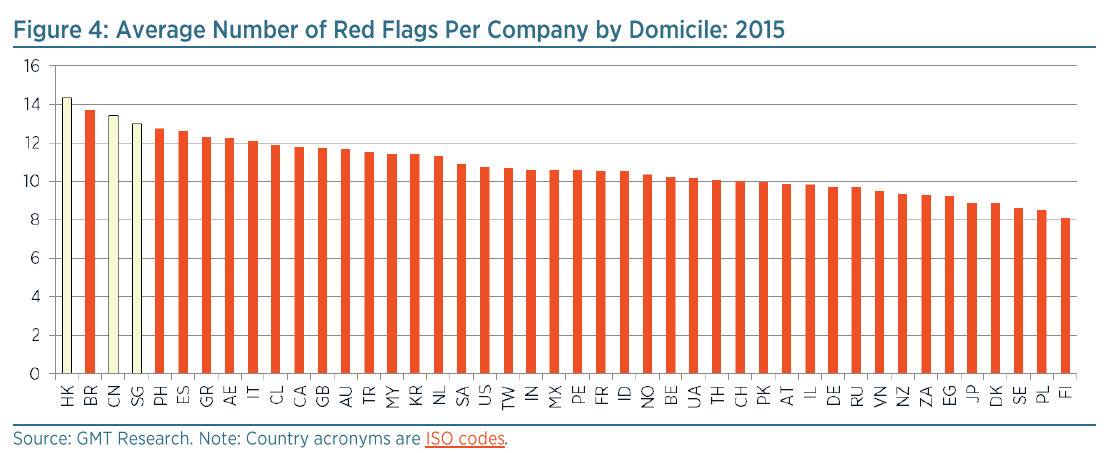
In Figure 4 we have calculated the average number of red flags per company by domicile. Interestingly, companies domiciled in Hong Kong have the highest average number of red flags globally, closely followed by China and Singapore. At the other end of the spectrum, Japanese and New Zealand companies have the least number of red flags.