Where cash is defined as “cash, cash equivalents and short term investments”.
We penalise companies with a low and/or falling or unusually high level of cash relative to industry peers. There are a number of reasons to be concerned about the level of cash a company maintains on its balance sheet:
1. Liquidity issues: A sharp drop in the level of cash to a low level might suggest that a company is facing liquidity issues, in particular if it has high debt levels and low operating cash flows.
2. Overly liquid balance sheet: Companies with overly liquid balance sheets (i.e. high levels of both debt and cash) might be involved in window dressing in order to flatter their financials. In other words, they sell short-term liquid assets to repay debt just before the end of the financial period, and then repurchase it immediately afterwards. This was very common amongst the US banks before the Global Financial Crisis. The banks maintained different year-ends from each other so that they could shift assets around the banking system and maintain seemly conservative leverage ratios.
Window dressing is difficult to spot. In addition to an overly liquid balance sheet, other indicators include the factoring of receivables and/or inventories. There should be some mention of the amounts factored or sold in the respective accounting notes although often this is not the case owing to sloppy audits. Failing that, the amounts factored should appear either in the operating cash flow or the financing section of the cash flow statement. If there is no mention in the notes to the accounts, the discount at which the receivables or inventories are sold should be disclosed in the interest expenses note.
Proceeds from the factoring of short-term assets are used to repay debt just before the accounting period ends. This creates a debt repayment entry in the financing section of the financial statements. As such, a high level of short-term debt repayment relative to the short-term debt disclosed at the beginning of the financial period can indicate that companies are window dressing. Furthermore, a high effective interest rate can be added confirmation that debt churn has been taking place. This is because the average debt level throughout the reporting period is actually far higher than disclosed at the period-end. For example, during 2012, Noble Group repaid US$4.3bn in debt versus short-term debt of US$655m. In other words, debt repayment was 6.5x short term debt. This resulted in an effective interest rate of 7.1% for a company that was of investment grade, and should have been paying half that amount.
3. Cash repatriation issues: Companies which have a high level of cash, generate free cash inflows and yet have a low dividend pay-out might be suffering from cash repatriation issues. After all, there is no excuse for a company with high recurring cash inflows and a large cash balance not to return surplus cash to shareholders. A company in this situation might be facing tax laws which make it disadvantageous to repatriate cash, such as Apple in the US; however, it could also suggest that the cash is not real and the company has engaged in a fraudulent round-tripping exercise to inflate reported profits. For example, SMC (6273 JP) in Japan bears the hallmarks of a company with cash repatriation issues. Cash equated to 91% of sales by end-FY16, up from 78% three years earlier, while debt was just 12% of sales. In other words, SMC’s cash balance was 7.5x its debt. Strong recurring free cash inflows equated to 16% of sales in FY16 and yet dividends were less than 3% of sales, equating to a pay-out ratio of just 27%.
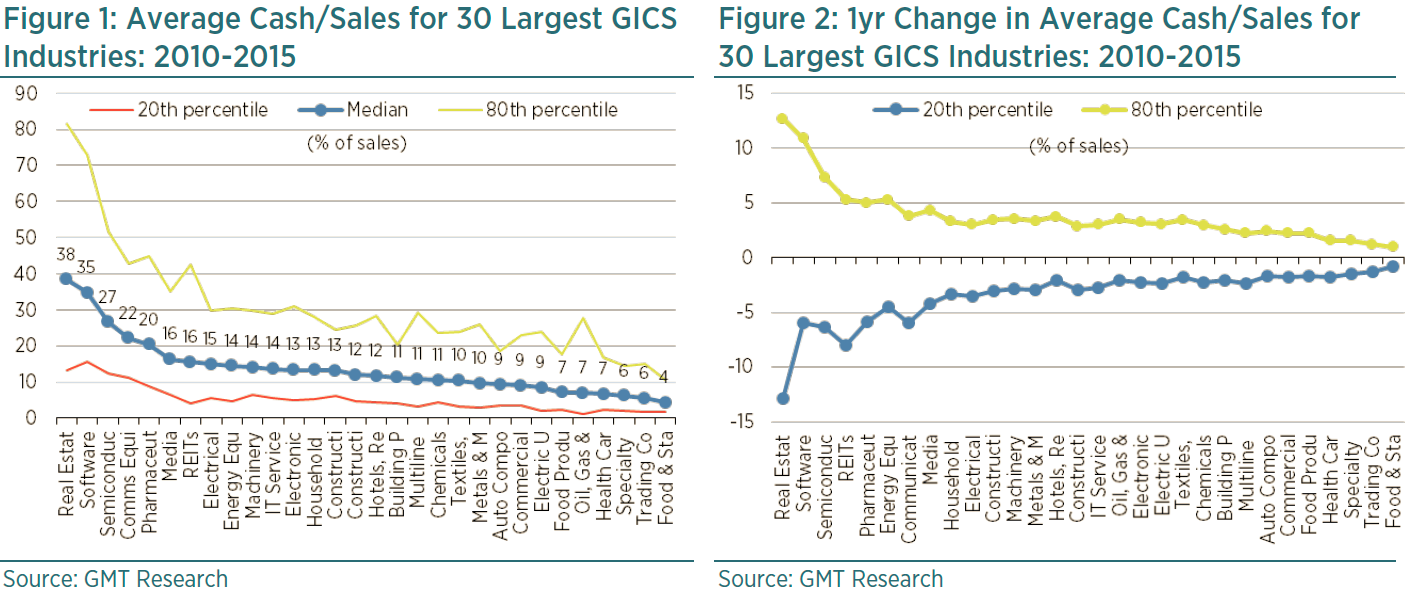
The amount of cash a company holds is primarily a function of its operating margin which, in turn, is largely defined by it industry; however, capital structure, domicile, working capital requirements and capital commitments are contributing factors. In general, low margin businesses, such as retailing and distribution, hold smaller amounts of cash than high margin ones, such as software and biotechnology, as shown in Figure 1. Indeed, the ten sub-sectors with the lowest cash, at 5-8% of sales, commanded an operating margin averaging just 6%; this compares to 14% for those industries with the largest cash balances, at 20-40% of sales.
Domicile also seems to have some bearing on the level of cash held. The Philippines, Hong Kong, China and Brazil would appear to hold the largest cash balances at 24-31% of sales, whilst Canada, Pakistan, India and Thailand hold the least at 7-8% of sales, as shown in Figure 3. It is not immediately obvious why there is such a discrepancy; however, Chinese companies tend to get paid by the government in the fourth quarter which might explain the higher cash balance. There is also a greater reliance on short term debt which might necessitate a higher cash balance. Another reason could be differing industry composition by market. For example, there are many property companies in the Philippines, China and Hong Kong, which tend to hold more cash.

Under our accounting screen a red flag is triggered when cash to sales exceeds the 80th percentile of its GICS industry peers (i.e. cash to sales is very high) or when it is below the 20th percentile (i.e. it is very low). Red flags are also triggered when cash/sales changes at an unusually large rate over 1 and 3 years. Again, this is when the increase is below the 20th percentile relative to industry peers between 2010 and 2015, or the drop exceeds the 80th percentile.