The cash conversion cycle is a metric which expresses the length of time, in days, that it takes for a company to convert resource inputs into cash flows. It is calculated as Inventory Turnover Days + Account Receivable Turnover Days - Accounts Payable Turnover Days.
We penalise companies where there is a large and/or growing cash conversion cycle relative to industry peers. We prefer companies that maintain an efficient and stable cash conversion cycle; large fluctuations can be cause for concern and indicative of deteriorating fundamentals.
A company’s cash conversion cycle is dictated more by the industry it operates in than its country of domicile. The real estate industry has the largest cash conversion cycle at approximately 870 days. This is due to large inventories which are financed by customer presales and/or extended payables with contractors. At the other end of the scale, retailers tend to have best working capital cycle at around nine days, as shown in Figure 95. Customers pay with cash at the point of sale, translating into a low level of receivables. Meanwhile, retailers are notoriously slow in paying their suppliers which results in significant payables.

The cash conversion cycle tends to fluctuate at around ten to twenty days on a year to year basis, as shown in Figure 96. In general, companies with the longest working capital cycle tend to experience the greatest fluctuations. It’s no surprise then that the real estate developers tend to see the largest fluctuations at 200-300 days in any given year (we have had to rescale the chart to exclude the property developers).
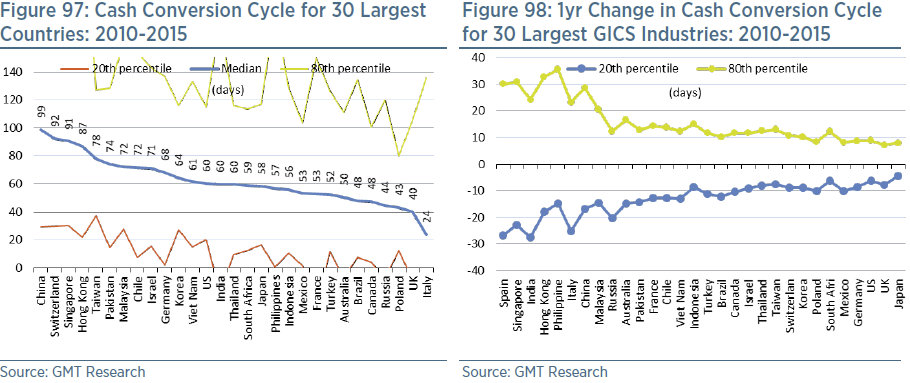
The cash conversion cycle country of domicile is shown in Figure 97. China has the longest cash conversion cycle at 99 days, followed by Switzerland (possibly due to the large number of pharmaceutical companies). Meanwhile, the UK and Italy have some of the shortest working capital cycles at less than 50 days. Much of the discrepancy by market is likely due to the composition of companies. For example, China is likely dominated by low value-added companies with poor working capital cycles compared to higher valued added and efficient companies in Europe. However, there are also likely to be significant differences in the supply chains within each country. For example, we know that China has experienced significant deterioration in terms of trade over the past five years which has led to a build-up of working capital.
Our accounting screen is set to trigger a red flag when the cash conversion cycle exceeds the 80th percentile (i.e. they are very high) relative to GICS industry peers, and/or when there is an abnormally large increase relative to the normal rate of change amongst industry peers over one and three years. This latter red flag is triggered when the deterioration in the cash conversion cycle sales exceeds the 80th percentile relative to the change experienced by industry peers between 2010 and 2015.