Gross debt to normalised profit is a rough measure of leverage which indicates how long it would take a company to repay its debt assuming that profits are backed-up by operating cash inflows.
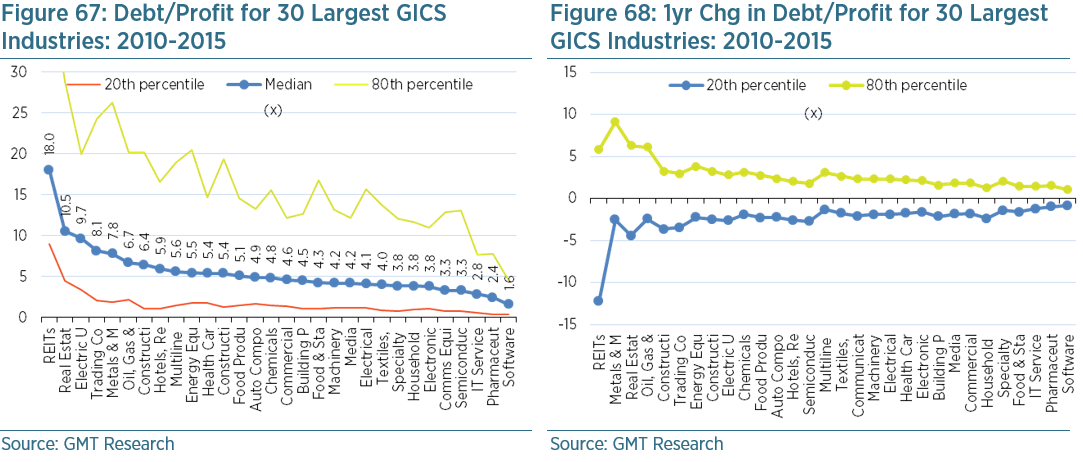
We penalise companies with high and/or rising gross debt/profit relative to industry peers. The global median average for our 16,000 companies between 2010 and 2015 was 5.6x (or 5.6 years). Given that the average loan duration is likely between three and five years, this is largely in line with expectations. However, there is considerable variance by industry. Those with long investment lead times which require project finance, such as electricity utilities, or are asset backed, such as real estate, have loan durations of up to 10 years. Meanwhile, those companies with limited capex requirements, such as software and IT, have low level of leverage below 3 years, as shown in Figure 67.
As such, our accounting screen is set to trigger a red flag when debt/profit exceeds the 80th percentile relative to its GICS industry peers, and/or when there is an abnormally large increase relative to the normal rate of change amongst industry peers over one and three years. This latter red flag is triggered when the increase in debt/profit exceeds the 80th percentile relative to the change experienced by GICS industry peers between 2010 and 2015.