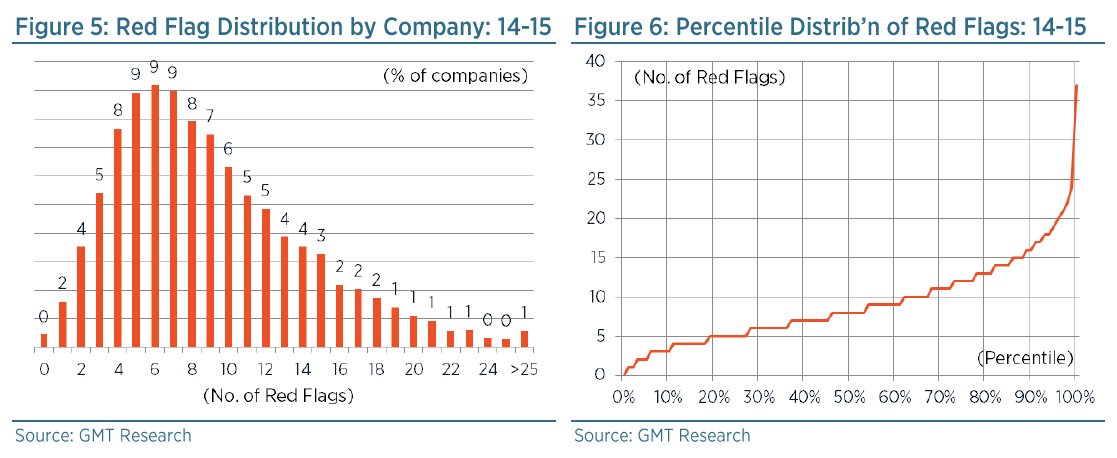
Arguably, incremental changes in ratios are of more insight than the absolute level of ratios. As such, we first count the number of red flags triggered by changes in ratios over the past year. Figure 5 shows the percentage distribution by number of red flags. For example, 9% of companies triggered 6 out of 53 red flags with the change in their financials over the past year. Around 58% of all 16,000 companies in our sample triggered between 5 and 12 red flags. Secondly, in order to give readers a sense of perspective, we percentile score the number of red flags against the global sample, as shown in Figure 6. For example, a company that triggered 22 red flags is in the 95th percentile relative to all 16,000 companies. This would be cause for concern.
We have calculated the number of red flags triggered by all 16,000 companies for the change in the financials in the year leading up to 2015. Chinese companies triggered the largest number of average red flags followed by Brazil. Once again, Hong Kong and Singapore were not far behind, as shown in Figure 7. Meanwhile, Japanese companies triggered some of the least amount of red flags.
