Includes any current assets which have not been included as a portion of cash & cash equivalents, marketable securities & other short-term investments, accounts & notes receivable, inventories, prepaid expenses or deferred tax assets. It includes current assets such as restricted cash, letters of credit, and derivative & hedging assets.
We penalise companies with large and/or growing other short term assets relative to industry peers. Other short term assets include any non-traditional items not captured in our other scans on current assets, such as cash, receivables, prepayments and inventory. The types of assets that get bundled in here include restricted cash, other receivables and prepayments, taxes receivables, assets held-for-sale, derivative & hedging assets, etc.. By monitoring this part of the financial statements, investors would have picked up on the extraordinary growth of Wilmar’s (WIL SP) restricted cash to US$8.5bn (held in long-term renminbi deposits) by end-2013, which it used to finance US$26bn in US dollar debt, mainly short term. In other words, the company was Asia’s largest leveraged bet on the US dollar/renminbi carry trade. For more reading, please refer to CURIOUS ASSETS: And dubious Profits (11 Feb 2015). Investors would also have picked up on the growth of Noble Group’s marked-to-market fair value gains which it was using to inflate profits. For more reading, please refer to NOBLE GROUP: Turning Tax Losses into Accounting Profits (1 Apr 2015).
While short term assets might trigger a red flag on our accounting screen, this in itself may not be problematic. However, investors should understand exactly what they relate to and understand why they exist.
For the most part, short term assets account for a relatively small portion of the corporate balance sheet, equating to 4% of sales on average. By comparison, cash typically equates to 15% of sales, receivables 14%, inventories 12% and prepayments just 1%. As the chart below shows, on an industry basis, short term assets range from around 2% of sales, up to 7%, with two industries outside this range, real estate development (10% of sales) and construction & engineering (19%). Much of this will be due to prepayments, which our other scan is unable to pick up on for some reason, restricted cash and other receivables.

Other short term assets tend to fluctuate by around 1-2% of sales in any given year, as Figure 20 shows. The only sectors which fluctuate by more are real estate development and construction & engineering, which is not surprising given that they are also more material as a percentage of sales.
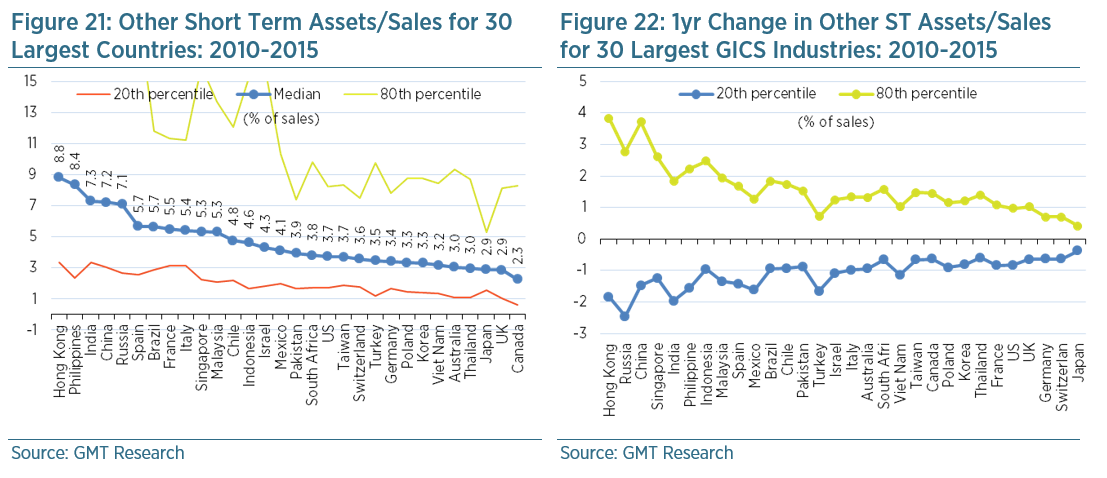
On a country basis there is a fairly large discrepancy in short term assets as a percentage of sales. Japan, the UK and Canada have the lowest exposure at less than 3% of sales, whilst Hong Kong, the Philippines, India, China and India have the highest in excess of 7%, as Figure 21 shows. This may be due to local trading practices, corporate governance issues or stock market composition. Still, we have decided that our accounting screen will default to comparisons with industry peers as opposed to country.
Our accounting screen is set to trigger a red flag when other short term assets/sales exceeds the 80th percentile (i.e. they are very high) relative to GICS industry peers, and/or when there is an abnormally large increase relative to the normal rate of change amongst industry peers over one and three years. This latter red flag is triggered when the deterioration in other short term assets to sales exceeds the 80th percentile relative to the change experienced by industry peers between 2010 and 2015.