Sales per employee can be a measure of efficiency. High and rising sales per employee suggests that a company is efficient and becoming more so; low and falling sales suggests the opposite. As expected there is considerable difference in sales per employee across markets. More developed economies tend to generate higher sales per employee than compared to emerging markets. However, there is even greater difference when comparing across industries. The oil and gas sector has generated the highest sales per employee between 2010 and 2015, as Figure 65 shows, at around US$1.7m/year; meanwhile, textile and resorts have generated some of the lowest sales, below US$150,000/year.
It should be noted that only 72% of companies out of our 16,000 sample have some disclose employee numbers on Bloomberg. Numbers are particularly sketchy for India, Australia, Singapore, Malaysia, Korea and Thailand.
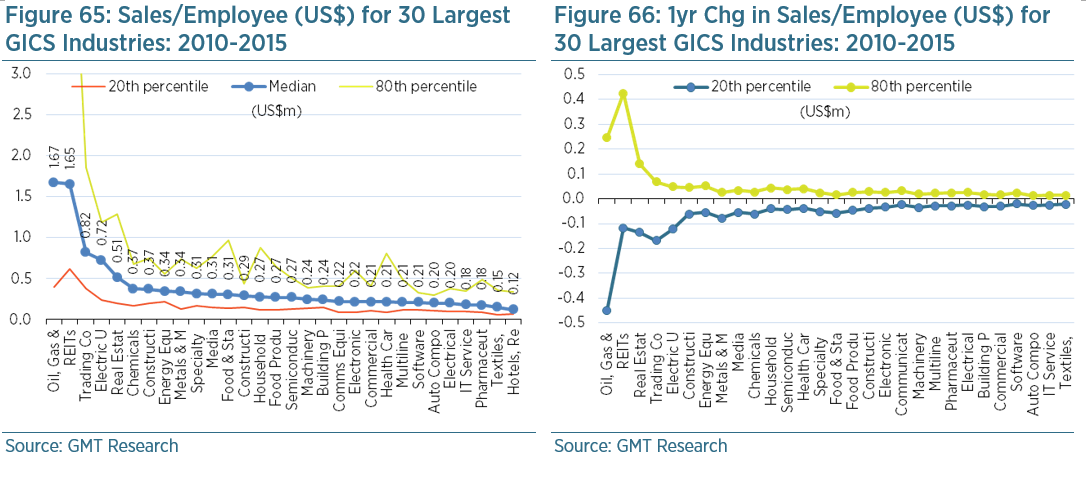
We are concerned when sales per employee are either too low or high relative to their industry peers and where there are unusually high changes in sales per employee. As such, under our accounting screen a red flag is triggered when sales per employee exceeds the 80th percentile of its GICS industry peers (i.e. sales per employee is very high) or when it is below the 20th percentile (i.e. it is very low). Red flags are also triggered when sales per employee drops or rises at an unusually fast rate over 1 and 3 years. Again, this is when the change in below the 20th percentile or above the 80th percentile relative to the change experienced by its peer group between 2010 and 2015.