
Share price window dressing
You’d be forgiven for thinking that share price manipulation was allowed in Hong Kong; no market is a complete stranger to such activities, but Hong Kong seems particularly prone. To illustrate the point, we’ve looked at the probable incidence rate of egregious window dressing at the recent year-end, 31 December 2017. There may be an incentive to boost share prices in order to inflate valuations and performance going into a financial year-end. Since December is the financial year-end for most businesses this is when we would expect to find some of the worst examples. Often, it’s not entirely clear who is manipulating a stock; it could be a fund a manager with a large position or a major shareholder with pledged shares.
We downloaded share price data around 31 December on all companies in Asia with a market capitalisation exceeding US$750m, which comes to around 6,000 companies. We only included companies on our shortlist if their prices ran up by more than 10% in the ten trading days before New Year, and then fell by more than 10% in the ten days after. Given the strict criteria, it is a short list with only 16 companies on it, as shown in Figure 1 (on any randomly chosen day the number of stocks is normally less than five). Interestingly, while Hong Kong-listed companies make up just 11% of the entire sample, they account for almost half of the companies on our shortlist.

Philtrust Bank
The most manipulated looking share price belongs, not to a Hong Kong company, but to Philtrust Bank, as shown in Figure 2. Its share price rose 45% in the ten days prior to the year-end and then fell 26% in the days after. A similar pattern occurred in the preceding two quarters (end-September and end-June). You have to wonder why its share price is so obviously manipulated, and why the regulator hasn’t stepped in to investigate.

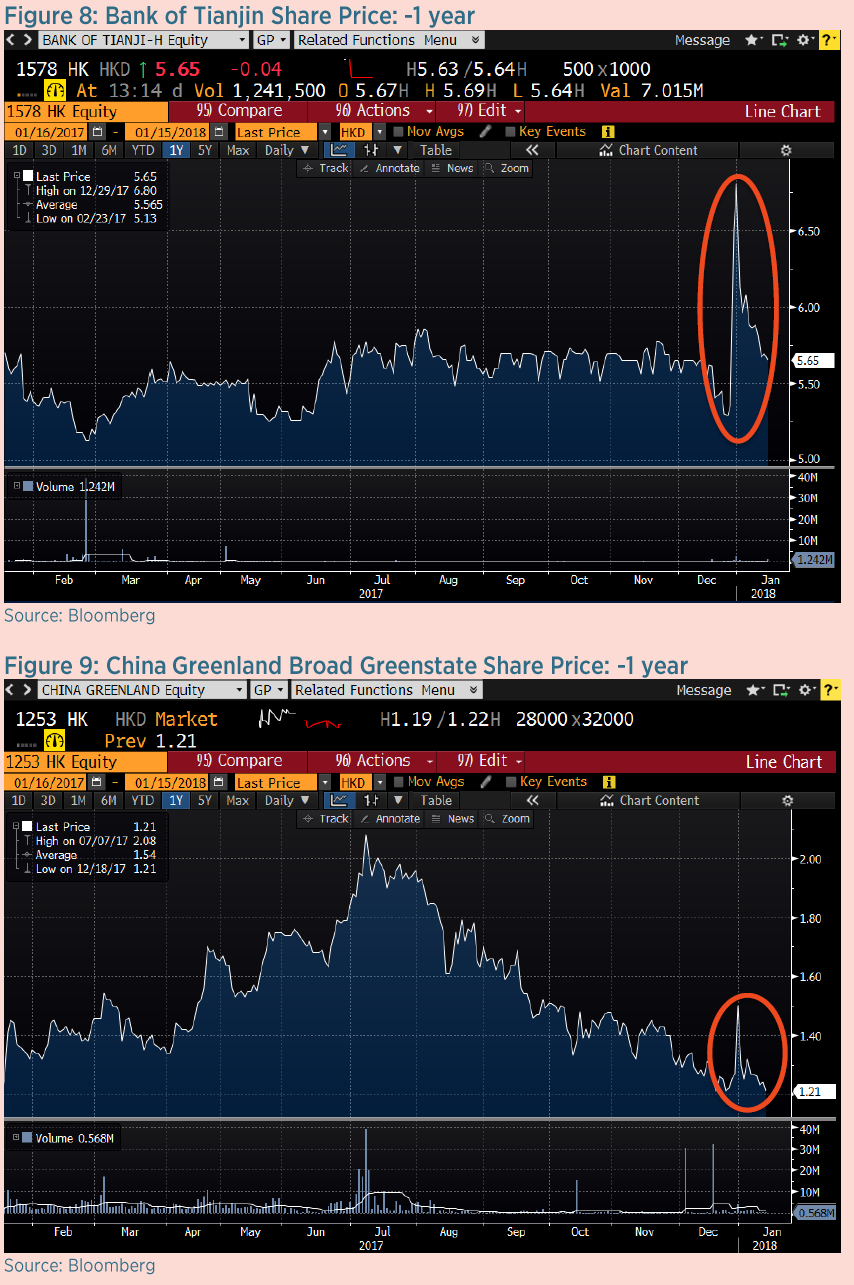
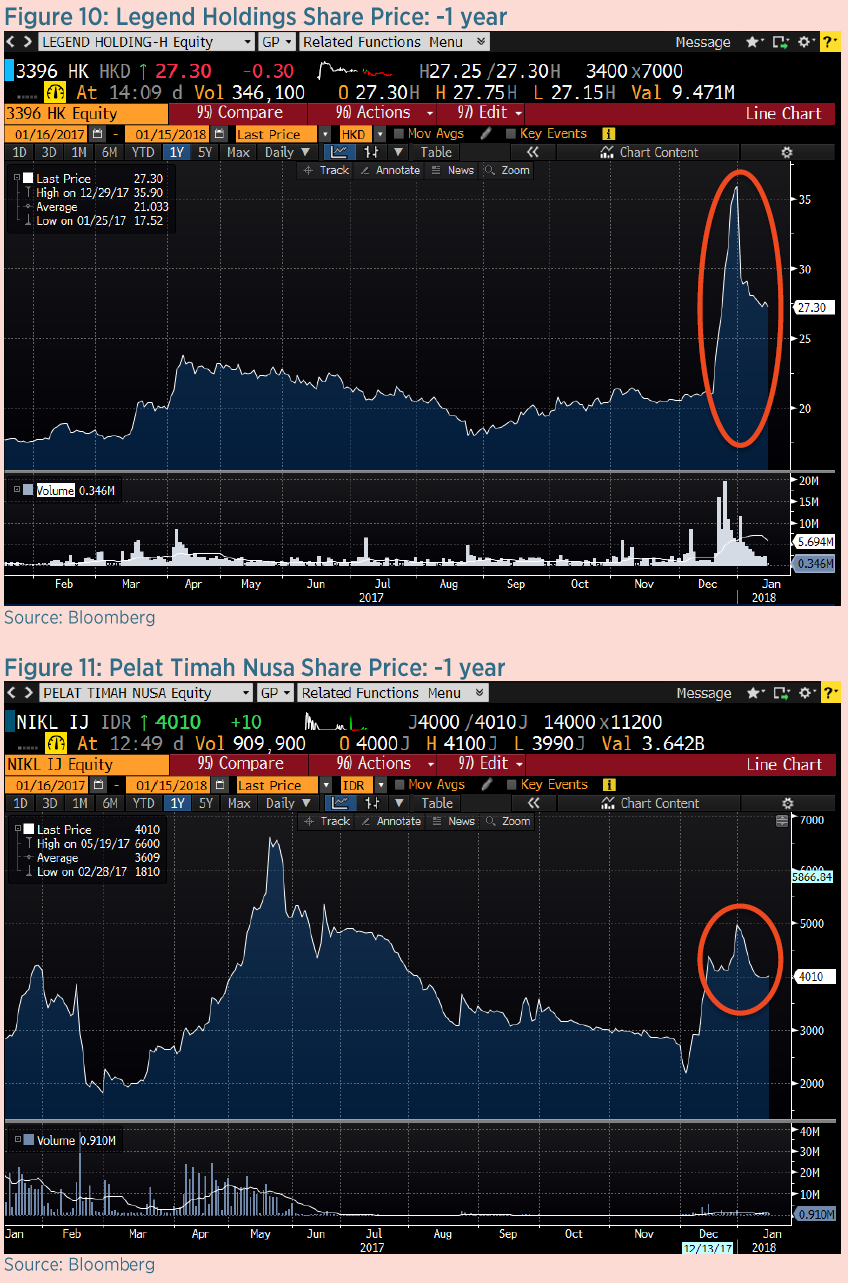
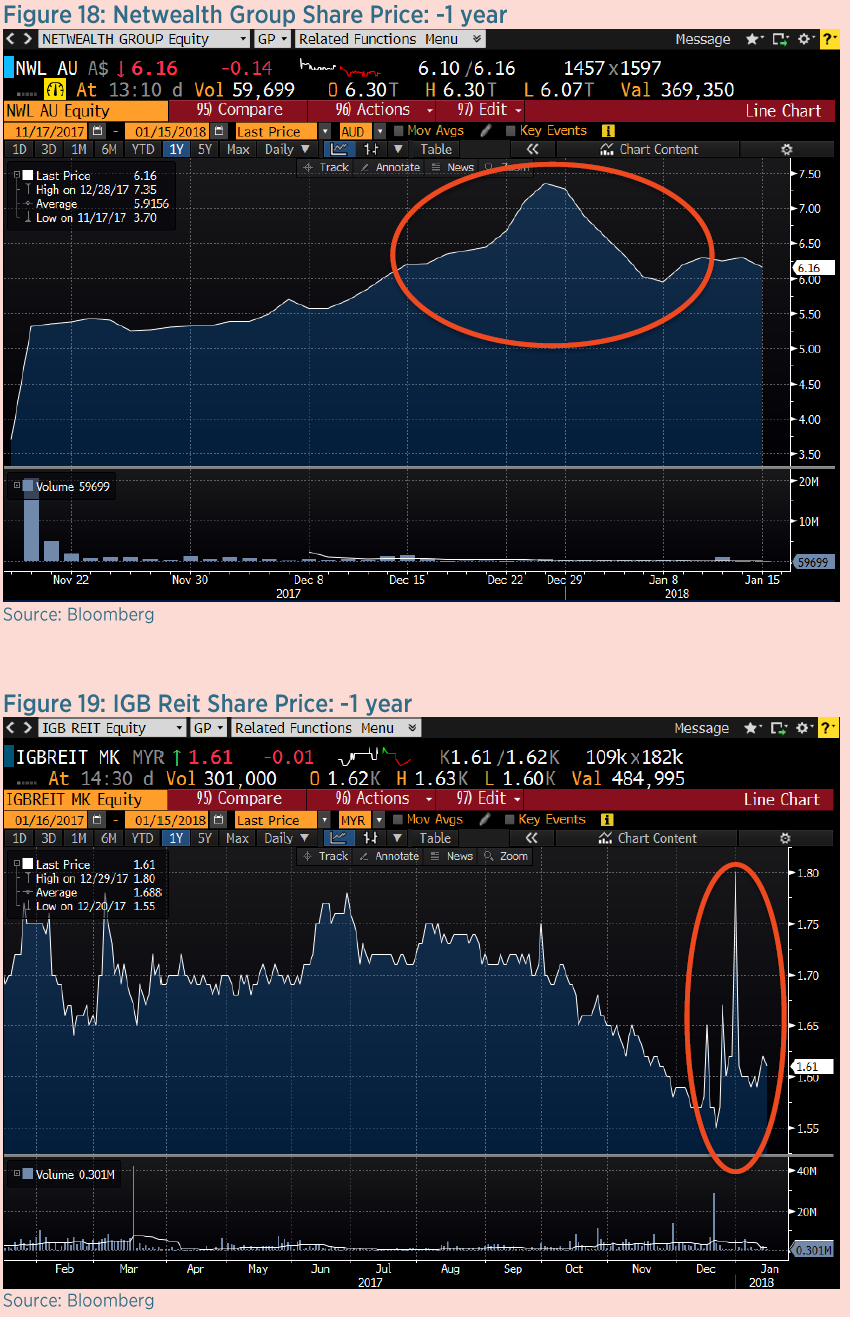
Also on our shortlist are some familiar names on which we’ve written in the past, including China High Speed Transmission. It seems that some names just keep reappearing on our screens for all the wrong reasons. In Appendix 1, we have reproduced the one-year share price charts for all the companies on our shortlist. Some of most interesting include Legend Holdings and Bank of Tianjin.
China High Speed Transmission
CHST is an intriguing case; it represents another chapter in the Fullshare saga. Fullshare took control of CHST at the end of 2016 after the successful completion of its all-share offer for the company, although CHST retained its separate listing.
Shortly after the offer closed, the CHST shares acquired by Fullshare were placed back into CCASS, the Hong Kong Exchange’s settlement system. Indeed, since early January 2017, 99.9% of CHST’s shares have been held in CCASS. In such circumstances, it is reasonable to assume the shares have been pledged, as there would be no other obvious reason to hold them in CCASS[3].
CHST has been increasingly popular with mainland investors over the last year: of the 25% free float, nearly 14% is now held through the Stock Connect. As Figure 3 shows, CHST’s share price rose sharply in late December last year, increasing by 35% from HK$10/share on 19 December to HK$13.50/share on 29 December; the shares were particularly active on 22 and 29 December, the last two trading days before Christmas and New Year, when the share price shot up by 16% and 12% respectively, on very high volumes, over 10x the daily average. Data from the exchange suggests that most of the shares were traded through the Stock Connect. The share price slumped immediately, falling by 11% on the first trading day of 2018. It is also worth noting that there was a similar spike in the share price at the end of September 2017.

Just a few weeks into the New Year, on 19 January 2018, Fullshare announced that it had entered into a memorandum of understanding with an unnamed mainland company regarding a “possible conditional voluntary partial cash offer” for up to 75% of CHST. Whether the possible offer and the share price shenanigans are related is unclear. Nonetheless, it seems that Fullshare is already planning to cash out of CHST, making the original transaction look suspiciously like a circuitous way for Fullshare to raise cash through a large equity issue; something it probably could not have done directly.
A similar story the year before
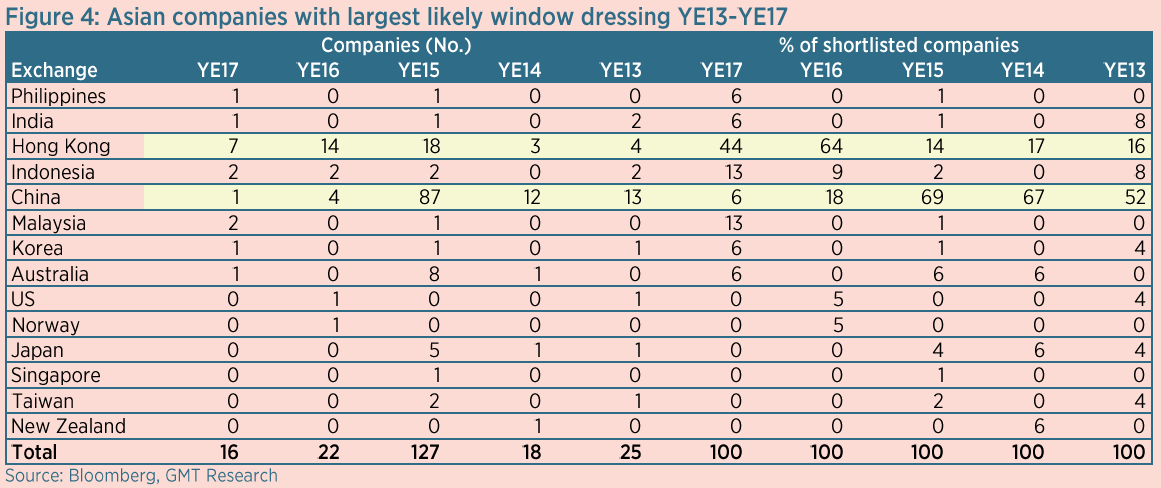
Interestingly, even more Hong Kong stocks look to have been manipulated at the previous year-end, YE16, with 14 having risen by more than 10% in the ten days before New Year, and falling by more than 10% in the ten days after. At YE15, the total number came to 18. Moreover, there were a further 87 companies listed in mainland China that looked equally manipulated. Indeed, A-shares dominated the list not just at YE15 but in the prior two years, as shown in Figure 4.
We suspect that the likely increase in the number of manipulated stocks in Hong Kong has to do with the opening of the Stock Connect[4] between Hong Kong, Shanghai and Shenzhen in November 2014. It suggests that either China’s securities regular, the CSRC, or Hong Kong’s regulator, the SFC, are unable or unwilling to prevent stock manipulation. However, it is possible that the overall decline in numbers suggests that they might be getting to grips with the situation.
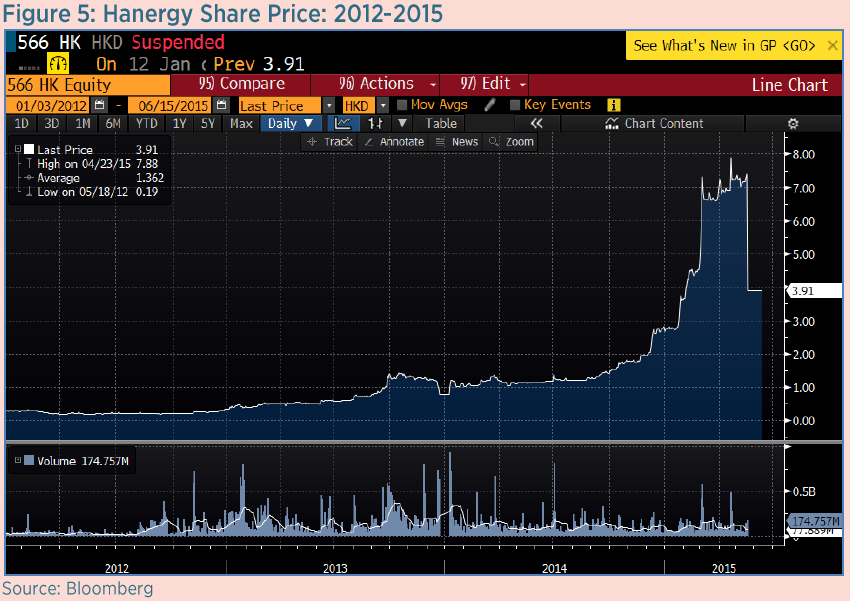
Hanergy manipulated up 4,100%
Year-end window dressing is not the only form of share price manipulation. Some share prices are manipulated up over long periods of time. Perhaps the most infamous example in Hong Kong was the case of Hanergy (566 HK, HTF), a manufacturer of thin film silicon solar modules. The company’s share price rose by over 4100% in the three years between 2012 and 2015, as shown in Figure 5, trading on a peak trailing price to sales of 27x, and 81x PER. At its height, the company had a market capitalisation of US$39bn, making its founder, Li Hejun, China’s richest man, the trading patterns behind the stock’s meteoric rise were highly unusual with most of the gains taking place in the last ten minutes of trading.
The Enigma Network
Any pretence that share price manipulation was a thing of the past in Hong Kong was dispelled by David Webb’s May 2017 exposé, entitled “The Enigma Network: 50 stocks not to own”.
Don’t criticize Hong Kong-listed companies
While the SFC might be slow to prosecute companies accused of market manipulation, it seems to show no such restraint when it comes to research providers critical of Hong Kong listed companies. The SFC[10] fined Moody’s HK$11m due to arithmetic errors in a 2011 report entitled “Red Flags for Emerging-Market Companies: A Focus on China”. Subsequent analysis by David Webb showed that the report’s error rate was about 1.2%[11]. If this is the standard being set, then we’re all in trouble. Furthermore, of the six stocks highlighted as being negative outliers, three had been suspended at the time of David Webb’s report, having recording significant share price declines. Furthermore, the SFC’s proceedings[12] against one of Asia’s most successful short-seller, Andrew Left of Citron Research, for a report written on China Evergrande was equally disturbing. As David Webb[13] once more points out, Mr Left was simply expressing his opinion. Ironically, it appears China Evergrande (and other companies) can manipulate its share price unhindered so long as it does so through share buybacks and adheres to the technical rules set out in the Exchange’s Listing Rules on maximum price, disclosure, etc.[14].
The problem with these prosecutions is the signal that it sends market participants. Economists spend a lot of time analysing the signals coming from central banks as an indicator of future policy direction. Similarly, stock market participants take their cue from the signals given by the regulator. One interpretation is that listed corporates can pretty much do what they want as long as it’s not on the front page of the newspapers. As for research analysts, don’t criticise Hong Kong listed companies or you’ll be run out of town.
This may be slightly unfair. The likelihood is that it’s very difficult for the SFC to prove share price manipulation beyond reasonable doubt (for a criminal conviction), or even on the balance of probabilities (for civil liability), given the use of proxies by those trying to create a false market. It’s also likely that the Hong Kong Stock Connect[15] makes it more difficult for the SFC to oversee mainland Chinese traders and monitor suspicious trading patterns. In other words, there appears to be a black hole in its regulatory oversight.


REFERENCE:
[1] GMT: FULLSHARE: Manufactured bubble, 27 Apr 2017
[2] GMT: CHINA GREENLAND BG: The Government’s unpaid gardener, 30 Mar 2017
[3] As David Webb explained in a recent article. See https://webb-site.com/articles/WCASupgrade.asp
[4] HKEx: What is Stock Connect?
[5] FT: Hanergy’s Li Hejun leaps to top of Forbes’ China rich list, 5 Mar 2015
[6] FT: Hanergy, The 10-minute trade, 25 Mar 2015
[7] SFC: SFC obtains disqualification and court orders, 4 Sep 2017
[8] Webb-site Reports: The Enigma Network: 50 stocks not to own, 15 May 2017
[9] Bloomberg: 'Enigma Network' Crash Spurs Hong Kong's Largest Financial Raid, 13 Oct 2017
[10] SFC: Court of Appeal upholds SFAT's ruling on SFC's disciplinary action against Moody’s over Red Flags Report, 8 Jun 2017
[11] Webb-site Reports: SFAT’s red flag on Moody’s chills negative research, 8 Apr 2016
[12] SFC: Market Misconduct Tribunal bans Andrew Left of Citron Research from trading securities in Hong Kong, 20 Oct 2016
[13] Webb-site Reports: Andrew Left and the right to be wrong, 23 Oct 2016
[14] See Listing Rules 10.06
[15] Stock Connect allows international and Mainland Chinese investors to trade securities in each other's markets through the trading and clearing facilities of their home exchange

